Tables, line graphs and pie charts
Read the quantities each display encodes and make conclusions limited to the recorded data.
Practise
More
Offline pages
Saved on this device only. Connect at least once every 30 days to confirm Premium. Sign-out or a change of account removes saved copies.
Find this activity in your course
On this page
You stopped at:
ContinueRevision Mode is on. Questions and activities are hidden.
Complete a table from the information
A survey records how 24 pupils travel to school: 12 walk, six take a bus and six cycle.
| Method | Pupils |
|---|---|
| Walk | 12 |
| Bus | 6 |
| Cycle | 6 |
| Total | 24 |
If the bus entry were missing, subtract the other categories from the total: 24-12-6 = 6. This works because each pupil is placed in exactly one category. Overlapping categories would need different information.
Use row and column totals together
A two-way table places each pupil in one class and one travel category. The same data have totals across rows and down columns.
| Class | Walk | Bus | Row total |
|---|---|---|---|
| A | 12 | ? | 20 |
| B | ? | 9 | 25 |
| Total | 28 | 17 | 45 |
Class A’s bus entry is 20-12 = 8. Class B’s walking entry is 25-9 = 16. Check down the columns: 12 + 16 = 28 and 8 + 9 = 17. The two classes contain 20 + 25 = 45 pupils. Adding both the row totals and the column totals would count the same pupils twice.
Check your understanding 1 Complete every missing entry
This table records visits to two clubs. Each visit belongs to exactly one club and one day. Find both question marks and check the column totals.
| Club | Monday | Tuesday | Row total |
|---|---|---|---|
| Art | 5 | ? | 14 |
| Music | ? | 7 | 13 |
| Total | 11 | 16 | 27 |
Show answer
Art on Tuesday is 14-5 = 9 visits. Music on Monday is 13-7 = 6 visits. The column checks are 5 + 6 = 11 and 9 + 7 = 16. Both columns also give 11 + 16 = 27 visits overall.
A pie chart divides one whole
In a pie chart, the whole circle represents the whole group. Here half the circle represents 12 walkers, and each quarter represents six pupils.
Travel survey
The whole circle represents 24 pupils. Sector letters identify the categories in the table.
View figure data
| Key | Category | Share |
|---|---|---|
| A | Walk | 2/4 |
| B | Bus | 1/4 |
| C | Cycle | 1/4 |
A larger sector means more of this whole. Equal-sized halves of circles for groups of different sizes do not necessarily represent equal numbers of people.
A line graph shows ordered observations
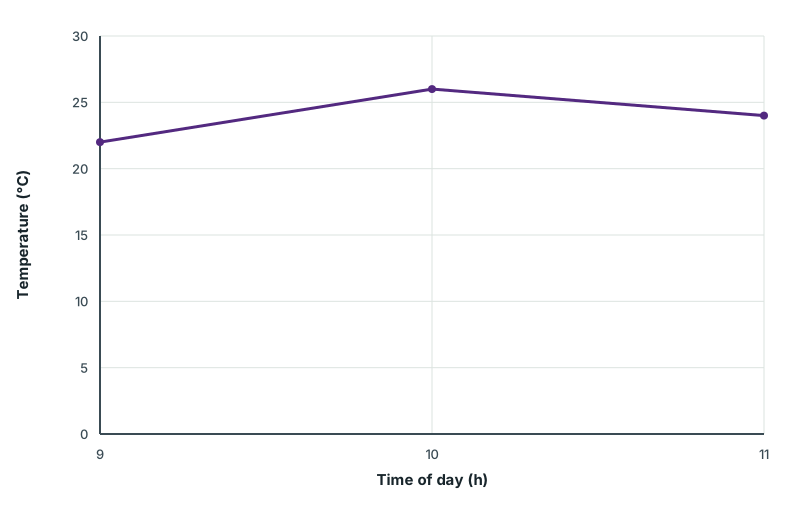
A weather record lists temperatures at 9 am, 10 am and 11 am. The figure’s data table keeps each recorded temperature beside its time.
A line graph places time along the horizontal axis and temperature along the vertical axis. Plot each pair at the matching tick values and join the successive observations. The graph rises from 9 am to 10 am, then falls to 11 am.
Morning temperatures
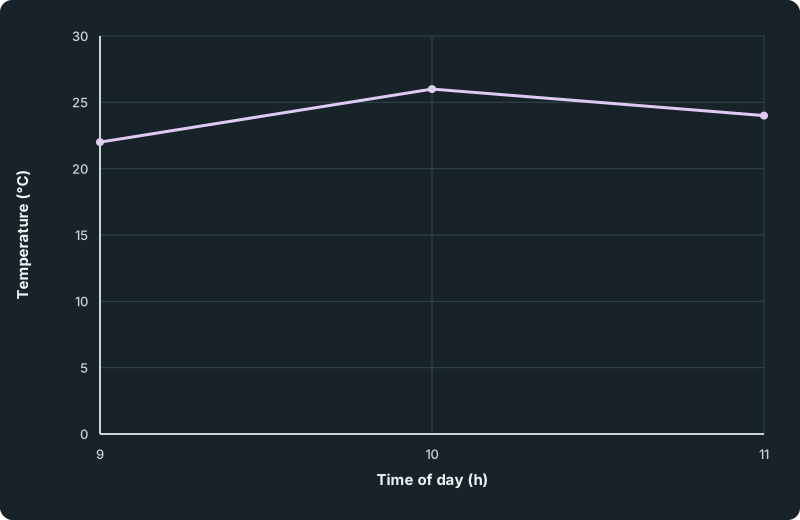
Three marked observations are joined in time order. Temperature rises from 22°C at 9 am to 26°C at 10 am, then falls to 24°C at 11 am. The temperature axis starts at zero and ends at 30°C.
Scroll across the figure to read all labels.
View figure data
| Time of day (h) | Recorded temperature (°C) |
|---|---|
| 9 | 22 |
| 10 | 26 |
| 11 | 24 |
Choose equally spaced marks for equal time intervals and equal temperature differences. Read the vertical scale before using a drawn height. The table gives no exact noon temperature; extending the line would be a prediction, not another measured observation.
Check your understanding 2 Read the observations, then compare them
Use the temperature graph. What was the change from 9 am to 11 am? At which recorded time was the temperature highest? Does the graph give an exact temperature at noon? Use the records to explain your answers.
Show answer
The records show 22°C at 9 am and 24°C at 11 am, an increase of 24-22 = 2°C. The highest recorded temperature is 26°C at 10 am. There is no noon observation, so the graph does not give an exact noon temperature. A continued line would make a prediction beyond the records.
Check your understanding 3 Find a missing entry
A different table records 35 pupils. Fourteen walk and nine cycle; all the others take the bus. How many take the bus?
Show answer
12 pupils: 35-14-9 = 12. Check that the three category totals add to 35.
Check your understanding 4 Same proportion, different whole
A pie chart shows half of a class of 24 walking. Another shows half of a class of 30 walking. Do both charts show the same number of walkers?
Show answer
No. The halves represent 12 pupils and 15 pupils. The proportions are equal, but the whole groups are different sizes. Read the total as well as the sector size.
When choosing a display, use a table for exact entries, a line graph for ordered observations and a pie chart for disjoint parts of a known whole. The display cannot supply information that was never collected.
Keep track of this lesson
Mark the lesson done when you have worked through it.
Lesson progress is optional and kept on this device.
Loading lesson controls…
Your lesson mark records your own study. Checks are kept separately in My Learning.