On this page
You stopped at:
ContinueRevision Mode is on. Questions and activities are hidden.
The linked question or activity is hidden by Revision Mode.
Fill in the missing number
Task reminder
How can the total help you find the missing number?
Each pupil chooses one travel method. The survey records 24 pupils altogether. Find the missing entry.
| Method | Pupils |
|---|---|
| Walk | 12 |
| Bus | ? |
| Cycle | 6 |
| Total | 24 |
Show workingHide answer
24 − 12 − 6 = 6 pupils take the bus. Check 12 + 6 + 6 = 24.
Each pupil belongs to exactly one group, so the category counts add to the whole. Some surveys let each pupil choose more than one answer. Then adding the groups could count a pupil more than once.
Use row and column totals together
Each pupil belongs to one class and uses one travel method. The rows and columns describe the same pupils in two ways. Complete all three question marks.
| Class | Walk | Bus | Row total |
|---|---|---|---|
| A | 12 | ? | 20 |
| B | ? | 9 | 25 |
| Total | 28 | 17 | ? |
Show workingHide answer
Class A’s bus entry is 20 − 12 = 8. Class B’s walking entry is 25 − 9 = 16. Check down the columns: 12 + 16 = 28, and 8 + 9 = 17.
There are 20 + 25 = 45 pupils. The column totals also give 28 + 17 = 45. Adding all four totals would give 90, counting every pupil twice.
Check your understanding 1
Complete every missing entry
Check your understanding 1
Complete every missing entry
Each club visit belongs to one club and one day. Find the missing entries. Use the other direction to check them.
| Club | Monday | Tuesday | Row total |
|---|---|---|---|
| Art | 5 | ? | 14 |
| Music | ? | 7 | 13 |
| Total | 11 | 16 | 27 |
Show answerHide answer
Art on Tuesday: 14 − 5 = 9 visits. Music on Monday: 13 − 7 = 6 visits. The columns check: 5 + 6 = 11, and 9 + 7 = 16.
The overall total is 14 + 13 = 27, or 11 + 16 = 27. It counts visits, so a pupil visiting on both days can contribute two visits.
Task reminder
What does the whole circle stand for?
Read parts of a circle
The whole circle represents 24 pupils. Its sector letters match the categories in the figure data. Use each share of the whole to find a number of pupils.
Travel survey
A is Walk, B is Bus and C is Cycle. The circle represents the whole group, rather than one pupil.
Scroll across to read every label.
Figure data
This table is included in print while it is open.
| Key | Category | Share |
|---|---|---|
| A | Walk | 2/4 |
| B | Bus | 1/4 |
| C | Cycle | 1/4 |
Show workingHide answer
Walk: 24 ÷ 2 = 12 pupils. Bus: 24 ÷ 4 = 6 pupils. Cycle is an equal quarter, so it also represents 6 pupils. Bus and Cycle together: 6 + 6 = 12 pupils.
The table and pie chart describe the same survey. The table shows exact category counts; the sectors show their shares of the whole.
Find the whole from one part
A different survey asks each pupil to choose one club. The Music sector represents 9 pupils. Find the total number surveyed and the number choosing Art.
One known part of a group
A is Art, B is Music and C is Drama. The sector shares are given, but the total number of pupils is not.
Scroll across to read every label.
Figure data
This table is included in print while it is open.
| Key | Category | Share |
|---|---|---|
| A | Art | 2/4 |
| B | Music | 1/4 |
| C | Drama | 1/4 |
Show workingHide answer
Music is one quarter, so one quarter represents 9 pupils. The whole group is 4 × 9 = 36 pupils. Art is one half, or two quarters: 2 × 9 = 18 pupils.
Check 18 + 9 + 9 = 36. Nine labels one sector’s count; it does not label the whole circle.
Task reminder
What do the points tell you about the temperature?
Check your understanding 2
Read the observations, then compare them
Check your understanding 2
Read the observations, then compare them
Read the 9 am, 10 am and 11 am points. Enter temperatures and compare them.
Morning temperatures
Three marked observations are joined in time order. Temperature rises from 22°C at 9 am to 26°C at 10 am, then falls to 24°C at 11 am. The temperature axis starts at zero and ends at 30°C.
Scroll across to read every label.
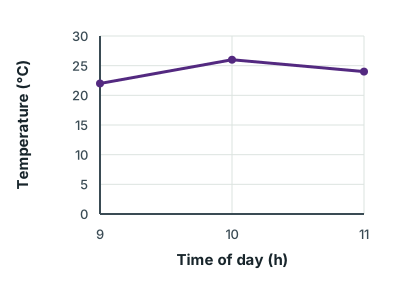
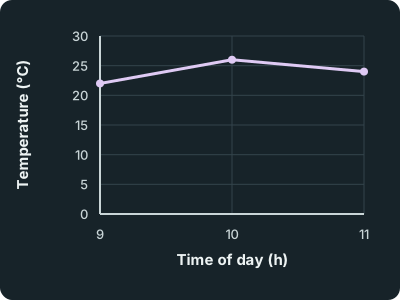
Figure data
This table is included in print while it is open.
| Time of day (h) | Recorded temperature (°C) |
|---|---|
| 9 | 22 |
| 10 | 26 |
| 11 | 24 |
Show answerHide answer
The records show 22°C at 9 am and 24°C at 11 am: an increase of 24 − 22 = 2°C. The highest recorded temperature is 26°C at 10 am.
The graph gives no exact noon temperature. Drawing the line further would show a prediction, not a measurement. Equal gaps along the bottom show equal lengths of time. Equal gaps up the side show equal temperature changes. This holds between labelled marks too.
Task reminder
Can half of one class be more than half of another?
Check your understanding 3
Same fraction, different whole
Check your understanding 3
Same fraction, different whole
Each chart shows half its class walking. Enter the number of walkers in each class.
Class A
The whole circle represents Class A. Read its total before finding the number in sector A.
Scroll across to read every label.
Figure data
This table is included in print while it is open.
| Key | Category | Share |
|---|---|---|
| A | Walk | 1/2 |
| B | Other travel methods | 1/2 |
Class B
The whole circle represents Class B. Its Walk share is also one half.
Scroll across to read every label.
Figure data
This table is included in print while it is open.
| Key | Category | Share |
|---|---|---|
| A | Walk | 1/2 |
| B | Other travel methods | 1/2 |
Show answerHide answer
Half of 24 is 12 pupils. Half of 30 is 15 pupils. The fractions are equal, but the whole groups have different sizes. The circle’s drawn size is not the number of people.
Task reminder
How can you check that you counted every pupil once?
Check your understanding 4
Find a missing entry
Check your understanding 4
Find a missing entry
A different class records 35 pupils. Fourteen walk and nine cycle; everyone else takes the bus. Each pupil gives exactly one answer. Find the missing number.
| Method | Pupils |
|---|---|
| Walk | 14 |
| Bus | ? |
| Cycle | 9 |
| Total | 35 |
Show answerHide answer
35 − 14 − 9 = 12 pupils take the bus. Check 14 + 12 + 9 = 35.
Use a table to show exact numbers. Use a line graph to show changes over time. Use a pie chart to show parts of a whole. A display cannot supply information that was never collected.
For a grown-up
Pip’s synthetic voice uses the University of Edinburgh’s Alba speech dataset, via Piper’s Alba voice, under CC BY 4.0. Audio is optional.
Loading reading progress…
Lesson done
- Monday
- Tuesday
- Wednesday
- Thursday
- Friday
- Saturday
- Sunday
Checking learning on this device…
Change goal
Progress options
Loading questions…
Syllabus and review details
- Primary 4 Mathematics 2024 · 2021-updated-2025-10
- Primary 6 Foundation Mathematics 2026 · 2021-updated-2025-10
Last reviewed: