Quadratic graphs and turning points
Use tables and symmetry to locate a quadratic curve’s roots and extremum.
More
Offline pages
Saved on this device only. Connect at least once every 30 days to confirm Premium. Sign-out or a change of account removes saved copies.
Find this activity in your course
On this page
You stopped at:
ContinueRevision Mode is on. Questions and activities are hidden.
A quadratic changes its gradient
For y = x²-4x + 3, calculate each output from the complete expression.
| x | −1 | 0 | 1 | 2 | 3 | 4 | 5 |
|---|---|---|---|---|---|---|---|
| y | 8 | 3 | 0 | −1 | 0 | 3 | 8 |
Outputs match at equal distances from x = 2, so the graph is symmetric about that vertical line. Plot a smooth curve rather than a broken line joining only the table entries.
A quadratic curve and its key points
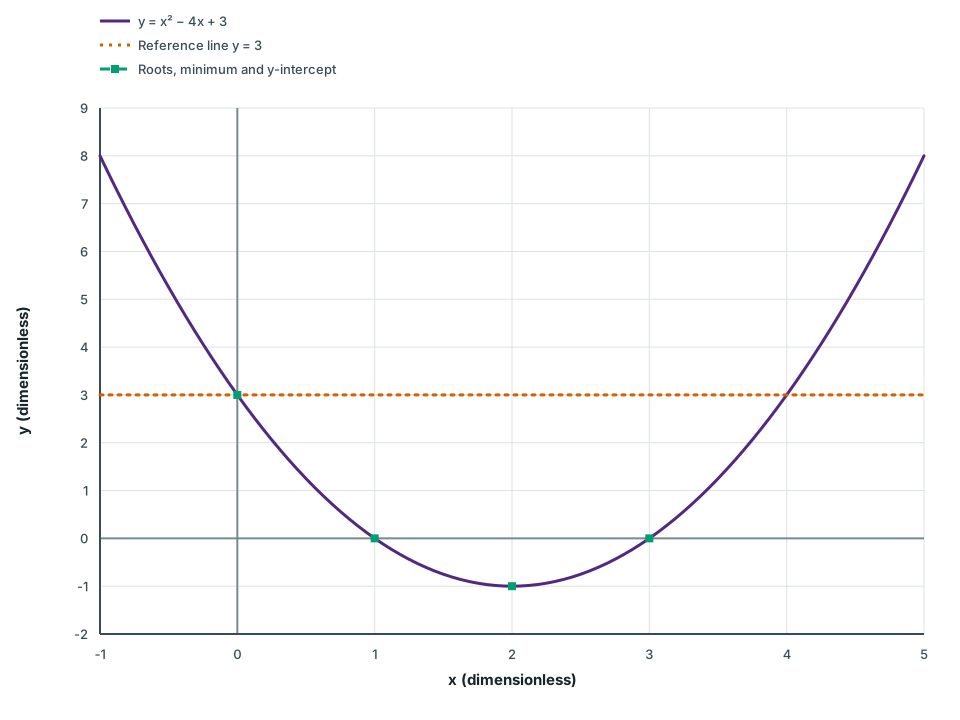
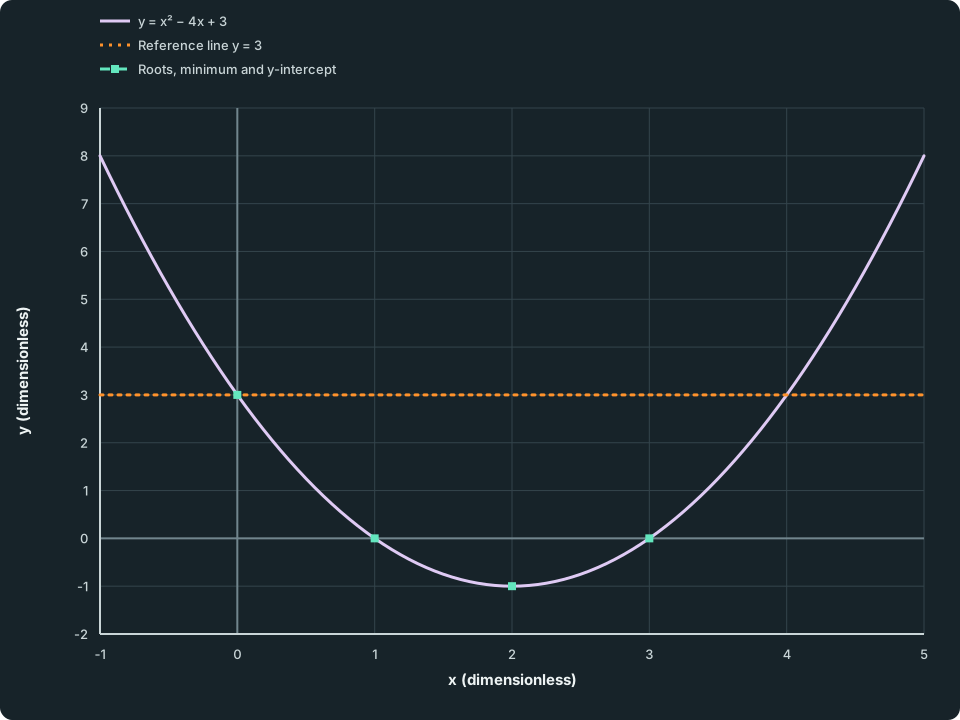
The upward-opening parabola y = x² − 4x + 3 is symmetric about x = 2. Filled squares mark its two roots, minimum and y-intercept. A dotted horizontal line shows y = 3.
Scroll across the figure to read all labels.
View figure data
| Series | x (dimensionless) | y (dimensionless) |
|---|---|---|
| y = x² − 4x + 3 | -1.0000 | 8.0000 |
| y = x² − 4x + 3 | -0.9375 | 7.6289 |
| y = x² − 4x + 3 | -0.8750 | 7.2656 |
| y = x² − 4x + 3 | -0.8125 | 6.9102 |
| y = x² − 4x + 3 | -0.7500 | 6.5625 |
| y = x² − 4x + 3 | -0.6875 | 6.2227 |
| y = x² − 4x + 3 | -0.6250 | 5.8906 |
| y = x² − 4x + 3 | -0.5625 | 5.5664 |
| y = x² − 4x + 3 | -0.5000 | 5.2500 |
| y = x² − 4x + 3 | -0.4375 | 4.9414 |
| y = x² − 4x + 3 | -0.3750 | 4.6406 |
| y = x² − 4x + 3 | -0.3125 | 4.3477 |
| y = x² − 4x + 3 | -0.2500 | 4.0625 |
| y = x² − 4x + 3 | -0.1875 | 3.7852 |
| y = x² − 4x + 3 | -0.1250 | 3.5156 |
| y = x² − 4x + 3 | -0.0625 | 3.2539 |
| y = x² − 4x + 3 | 0.0000 | 3.0000 |
| y = x² − 4x + 3 | 0.0625 | 2.7539 |
| y = x² − 4x + 3 | 0.1250 | 2.5156 |
| y = x² − 4x + 3 | 0.1875 | 2.2852 |
| y = x² − 4x + 3 | 0.2500 | 2.0625 |
| y = x² − 4x + 3 | 0.3125 | 1.8477 |
| y = x² − 4x + 3 | 0.3750 | 1.6406 |
| y = x² − 4x + 3 | 0.4375 | 1.4414 |
| y = x² − 4x + 3 | 0.5000 | 1.2500 |
| y = x² − 4x + 3 | 0.5625 | 1.0664 |
| y = x² − 4x + 3 | 0.6250 | 0.8906 |
| y = x² − 4x + 3 | 0.6875 | 0.7227 |
| y = x² − 4x + 3 | 0.7500 | 0.5625 |
| y = x² − 4x + 3 | 0.8125 | 0.4102 |
| y = x² − 4x + 3 | 0.8750 | 0.2656 |
| y = x² − 4x + 3 | 0.9375 | 0.1289 |
| y = x² − 4x + 3 | 1.0000 | 0.0000 |
| y = x² − 4x + 3 | 1.0625 | -0.1211 |
| y = x² − 4x + 3 | 1.1250 | -0.2344 |
| y = x² − 4x + 3 | 1.1875 | -0.3398 |
| y = x² − 4x + 3 | 1.2500 | -0.4375 |
| y = x² − 4x + 3 | 1.3125 | -0.5273 |
| y = x² − 4x + 3 | 1.3750 | -0.6094 |
| y = x² − 4x + 3 | 1.4375 | -0.6836 |
| y = x² − 4x + 3 | 1.5000 | -0.7500 |
| y = x² − 4x + 3 | 1.5625 | -0.8086 |
| y = x² − 4x + 3 | 1.6250 | -0.8594 |
| y = x² − 4x + 3 | 1.6875 | -0.9023 |
| y = x² − 4x + 3 | 1.7500 | -0.9375 |
| y = x² − 4x + 3 | 1.8125 | -0.9648 |
| y = x² − 4x + 3 | 1.8750 | -0.9844 |
| y = x² − 4x + 3 | 1.9375 | -0.9961 |
| y = x² − 4x + 3 | 2.0000 | -1.0000 |
| y = x² − 4x + 3 | 2.0625 | -0.9961 |
| y = x² − 4x + 3 | 2.1250 | -0.9844 |
| y = x² − 4x + 3 | 2.1875 | -0.9648 |
| y = x² − 4x + 3 | 2.2500 | -0.9375 |
| y = x² − 4x + 3 | 2.3125 | -0.9023 |
| y = x² − 4x + 3 | 2.3750 | -0.8594 |
| y = x² − 4x + 3 | 2.4375 | -0.8086 |
| y = x² − 4x + 3 | 2.5000 | -0.7500 |
| y = x² − 4x + 3 | 2.5625 | -0.6836 |
| y = x² − 4x + 3 | 2.6250 | -0.6094 |
| y = x² − 4x + 3 | 2.6875 | -0.5273 |
| y = x² − 4x + 3 | 2.7500 | -0.4375 |
| y = x² − 4x + 3 | 2.8125 | -0.3398 |
| y = x² − 4x + 3 | 2.8750 | -0.2344 |
| y = x² − 4x + 3 | 2.9375 | -0.1211 |
| y = x² − 4x + 3 | 3.0000 | 0.0000 |
| y = x² − 4x + 3 | 3.0625 | 0.1289 |
| y = x² − 4x + 3 | 3.1250 | 0.2656 |
| y = x² − 4x + 3 | 3.1875 | 0.4102 |
| y = x² − 4x + 3 | 3.2500 | 0.5625 |
| y = x² − 4x + 3 | 3.3125 | 0.7227 |
| y = x² − 4x + 3 | 3.3750 | 0.8906 |
| y = x² − 4x + 3 | 3.4375 | 1.0664 |
| y = x² − 4x + 3 | 3.5000 | 1.2500 |
| y = x² − 4x + 3 | 3.5625 | 1.4414 |
| y = x² − 4x + 3 | 3.6250 | 1.6406 |
| y = x² − 4x + 3 | 3.6875 | 1.8477 |
| y = x² − 4x + 3 | 3.7500 | 2.0625 |
| y = x² − 4x + 3 | 3.8125 | 2.2852 |
| y = x² − 4x + 3 | 3.8750 | 2.5156 |
| y = x² − 4x + 3 | 3.9375 | 2.7539 |
| y = x² − 4x + 3 | 4.0000 | 3.0000 |
| y = x² − 4x + 3 | 4.0625 | 3.2539 |
| y = x² − 4x + 3 | 4.1250 | 3.5156 |
| y = x² − 4x + 3 | 4.1875 | 3.7852 |
| y = x² − 4x + 3 | 4.2500 | 4.0625 |
| y = x² − 4x + 3 | 4.3125 | 4.3477 |
| y = x² − 4x + 3 | 4.3750 | 4.6406 |
| y = x² − 4x + 3 | 4.4375 | 4.9414 |
| y = x² − 4x + 3 | 4.5000 | 5.2500 |
| y = x² − 4x + 3 | 4.5625 | 5.5664 |
| y = x² − 4x + 3 | 4.6250 | 5.8906 |
| y = x² − 4x + 3 | 4.6875 | 6.2227 |
| y = x² − 4x + 3 | 4.7500 | 6.5625 |
| y = x² − 4x + 3 | 4.8125 | 6.9102 |
| y = x² − 4x + 3 | 4.8750 | 7.2656 |
| y = x² − 4x + 3 | 4.9375 | 7.6289 |
| y = x² − 4x + 3 | 5.0000 | 8.0000 |
| Reference line y = 3 | -1.0000 | 3.0000 |
| Reference line y = 3 | 5.0000 | 3.0000 |
| Roots, minimum and y-intercept | 1.0000 | 0.0000 |
| Roots, minimum and y-intercept | 3.0000 | 0.0000 |
| Roots, minimum and y-intercept | 2.0000 | -1.0000 |
| Roots, minimum and y-intercept | 0.0000 | 3.0000 |
The sign of the leading coefficient matters
A positive coefficient of x² gives an upward-opening parabola with a minimum. A negative coefficient gives a downward-opening parabola with a maximum. The turning point has two coordinates: the x-value where it occurs and the y-value reached.
For this graph the minimum is −1 at x = 2. Its roots are 1 and 3, where y = 0. Its y-intercept is 3, where x = 0. These are different features.
For y = -x² + 4, the vertex is (0,4), the symmetry line is x = 0, and the roots are −2 and 2. A negative leading coefficient does not make every output negative.
Check your understanding 1 Use the symmetry before drawing
A quadratic graph has symmetry line x = 3 and contains the point (1, 7). Give the matching point on the other side. Does this information alone give its roots?
Show answer
The matching point is (5, 7), two units to the other side of x = 3. These facts alone do not determine the roots or even establish that the curve crosses the x axis.
Read intersections as equation solutions
The intersections of y = x²-4x + 3 with the horizontal line y = 3 have x-values 0 and 4. They solve x²-4x + 3 = 3, which is a different equation from setting the quadratic equal to zero. Read which output the task requests.
Keep track of this lesson
Mark the lesson done when you have worked through it.
Lesson progress is optional and kept on this device.
Loading lesson controls…
Your lesson mark records your own study. Checks are kept separately in My Learning.