Trigonometric graphs and models
Read input/output scaling, preserve tangent discontinuities and infer a bounded periodic model with correct phase units.
More
Offline pages
Saved on this device only. Connect at least once every 30 days to confirm Premium. Sign-out or a change of account removes saved copies.
Find this activity in your course
On this page
You stopped at:
ContinueRevision Mode is on. Questions and activities are hidden.
Scaling input and output have different effects
In y = a sin(bx) + c, with a ≠ 0 and b > 0, the sine value is multiplied by a and then shifted by c. Sine still runs from −1 to 1, so the wave has midline y = c, amplitude |a| and range c − |a| to c + |a|. A negative a reflects the wave in its midline; it does not give a negative amplitude.
The input coefficient changes how quickly the angle completes a turn. For b > 0, sin(bx) completes one cycle when bx increases by 2π radians, so x increases by 2π/b. In sin(x/b), x must instead increase by 2πb to produce that same full turn.
| Form, with a ≠ 0 and b > 0 | Period when x is in radians | Period when x is in degrees |
|---|---|---|
| a sin(bx) + c or a cos(bx) + c | 2π/b | 360°/b |
| a sin(x/b) + c or a cos(x/b) + c | 2πb | 360°b |
Cosine follows the same amplitude and period rules, but has a different starting value. A sine wave starts at its midline at x = 0; a cosine wave starts at c + a. Thus a negative cosine coefficient makes it start at its minimum.
Halving the input rate doubles the period
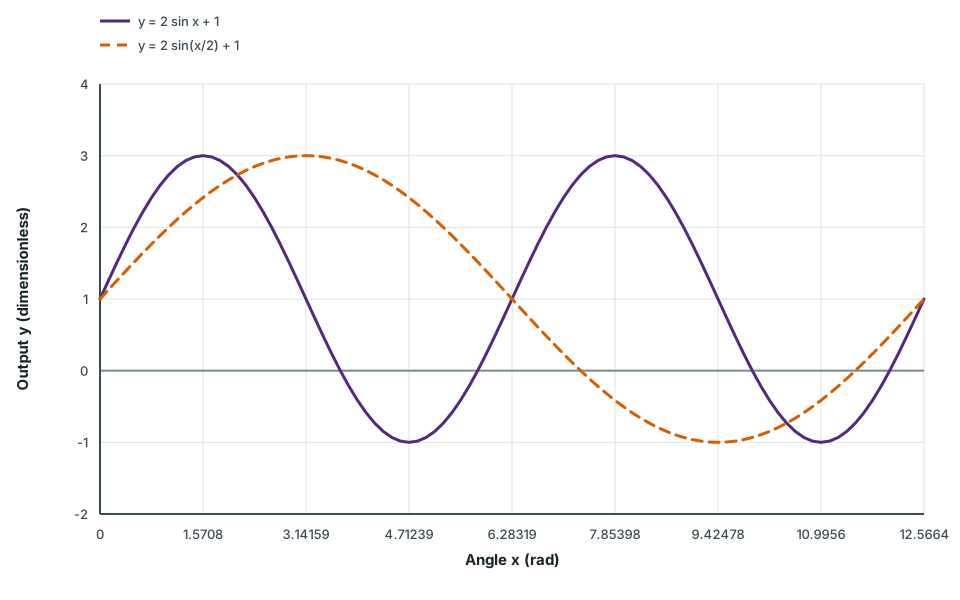
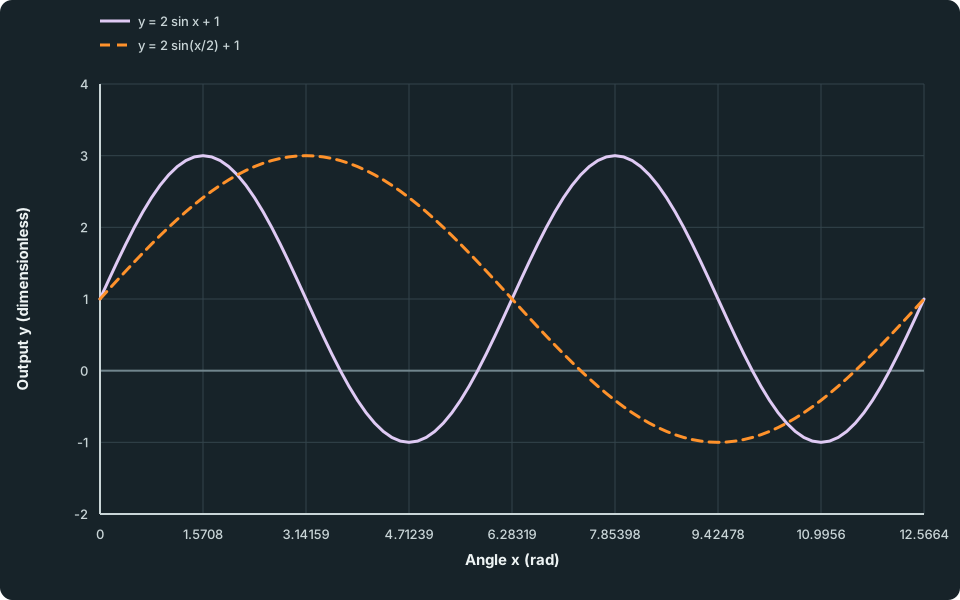
Two sine waves share their vertical range and start at output 1. The solid wave reaches its first maximum at x = π/2 and repeats after 2π; the dashed wave reaches its first maximum at π and repeats after 4π.
Scroll across the figure to read all labels.
View figure data
| Angle x (rad) | y = 2 sin x + 1 | y = 2 sin(x/2) + 1 |
|---|---|---|
| 0.0000 | 1.0000 | 1.0000 |
| 0.1309 | 1.2611 | 1.1308 |
| 0.2618 | 1.5176 | 1.2611 |
| 0.3927 | 1.7654 | 1.3902 |
| 0.5236 | 2.0000 | 1.5176 |
| 0.6545 | 2.2175 | 1.6429 |
| 0.7854 | 2.4142 | 1.7654 |
| 0.9163 | 2.5867 | 1.8846 |
| 1.0472 | 2.7321 | 2.0000 |
| 1.1781 | 2.8478 | 2.1111 |
| 1.3090 | 2.9319 | 2.2175 |
| 1.4399 | 2.9829 | 2.3187 |
| 1.5708 | 3.0000 | 2.4142 |
| 1.7017 | 2.9829 | 2.5037 |
| 1.8326 | 2.9319 | 2.5867 |
| 1.9635 | 2.8478 | 2.6629 |
| 2.0944 | 2.7321 | 2.7321 |
| 2.2253 | 2.5867 | 2.7937 |
| 2.3562 | 2.4142 | 2.8478 |
| 2.4871 | 2.2175 | 2.8939 |
| 2.6180 | 2.0000 | 2.9319 |
| 2.7489 | 1.7654 | 2.9616 |
| 2.8798 | 1.5176 | 2.9829 |
| 3.0107 | 1.2611 | 2.9957 |
| 3.1416 | 1.0000 | 3.0000 |
| 3.2725 | 0.7389 | 2.9957 |
| 3.4034 | 0.4824 | 2.9829 |
| 3.5343 | 0.2346 | 2.9616 |
| 3.6652 | 0.0000 | 2.9319 |
| 3.7961 | -0.2175 | 2.8939 |
| 3.9270 | -0.4142 | 2.8478 |
| 4.0579 | -0.5867 | 2.7937 |
| 4.1888 | -0.7321 | 2.7321 |
| 4.3197 | -0.8478 | 2.6629 |
| 4.4506 | -0.9319 | 2.5867 |
| 4.5815 | -0.9829 | 2.5037 |
| 4.7124 | -1.0000 | 2.4142 |
| 4.8433 | -0.9829 | 2.3187 |
| 4.9742 | -0.9319 | 2.2175 |
| 5.1051 | -0.8478 | 2.1111 |
| 5.2360 | -0.7321 | 2.0000 |
| 5.3669 | -0.5867 | 1.8846 |
| 5.4978 | -0.4142 | 1.7654 |
| 5.6287 | -0.2175 | 1.6429 |
| 5.7596 | 0.0000 | 1.5176 |
| 5.8905 | 0.2346 | 1.3902 |
| 6.0214 | 0.4824 | 1.2611 |
| 6.1523 | 0.7389 | 1.1308 |
| 6.2832 | 1.0000 | 1.0000 |
| 6.4141 | 1.2611 | 0.8692 |
| 6.5450 | 1.5176 | 0.7389 |
| 6.6759 | 1.7654 | 0.6098 |
| 6.8068 | 2.0000 | 0.4824 |
| 6.9377 | 2.2175 | 0.3571 |
| 7.0686 | 2.4142 | 0.2346 |
| 7.1995 | 2.5867 | 0.1154 |
| 7.3304 | 2.7321 | 0.0000 |
| 7.4613 | 2.8478 | -0.1111 |
| 7.5922 | 2.9319 | -0.2175 |
| 7.7231 | 2.9829 | -0.3187 |
| 7.8540 | 3.0000 | -0.4142 |
| 7.9849 | 2.9829 | -0.5037 |
| 8.1158 | 2.9319 | -0.5867 |
| 8.2467 | 2.8478 | -0.6629 |
| 8.3776 | 2.7321 | -0.7321 |
| 8.5085 | 2.5867 | -0.7937 |
| 8.6394 | 2.4142 | -0.8478 |
| 8.7703 | 2.2175 | -0.8939 |
| 8.9012 | 2.0000 | -0.9319 |
| 9.0321 | 1.7654 | -0.9616 |
| 9.1630 | 1.5176 | -0.9829 |
| 9.2939 | 1.2611 | -0.9957 |
| 9.4248 | 1.0000 | -1.0000 |
| 9.5557 | 0.7389 | -0.9957 |
| 9.6866 | 0.4824 | -0.9829 |
| 9.8175 | 0.2346 | -0.9616 |
| 9.9484 | 0.0000 | -0.9319 |
| 10.0793 | -0.2175 | -0.8939 |
| 10.2102 | -0.4142 | -0.8478 |
| 10.3411 | -0.5867 | -0.7937 |
| 10.4720 | -0.7321 | -0.7321 |
| 10.6029 | -0.8478 | -0.6629 |
| 10.7338 | -0.9319 | -0.5867 |
| 10.8647 | -0.9829 | -0.5037 |
| 10.9956 | -1.0000 | -0.4142 |
| 11.1265 | -0.9829 | -0.3187 |
| 11.2574 | -0.9319 | -0.2175 |
| 11.3883 | -0.8478 | -0.1111 |
| 11.5192 | -0.7321 | 0.0000 |
| 11.6501 | -0.5867 | 0.1154 |
| 11.7810 | -0.4142 | 0.2346 |
| 11.9119 | -0.2175 | 0.3571 |
| 12.0428 | 0.0000 | 0.4824 |
| 12.1737 | 0.2346 | 0.6098 |
| 12.3046 | 0.4824 | 0.7389 |
| 12.4355 | 0.7389 | 0.8692 |
| 12.5664 | 1.0000 | 1.0000 |
For y = 2 sin x + 1, the range is [−1,3] and the period 2π. The wave y = 2 sin(x/2) + 1 has the same range but takes twice as much x to complete each cycle. These quarter-cycle points show the mapping exactly:
| Phase inside sine | x for 2 sin x + 1 | x for 2 sin(x/2) + 1 | Output on either wave |
|---|---|---|---|
| 0 | 0 | 0 | 1 |
| π/2 | π/2 | π | 3 |
| π | π | 2π | 1 |
| 3π/2 | 3π/2 | 3π | −1 |
| 2π | 2π | 4π | 1 |
A period returns to the same position and direction in the cycle. The two midline crossings within a sine cycle have opposite directions, so their separation is only half a period. Increasing output by c changes none of these input spacings.
The unit-circle symmetries also appear in graphs: sin(−x) = −sin x makes the unshifted sine graph symmetric about the origin, while cos(−x) = cos x makes cosine symmetric about the vertical axis. Shifting a sine wave up by c moves its centre of rotational symmetry to (0,c).
Check your understanding 1 The bracket determines the period
Give the amplitude, range and period in degrees of y = -3 cos(2x) + 4. Compare its period with y = -3 cos(x/2) + 4. Explain the starting value and why the amplitude is positive in both cases.
Show answer
The amplitude is 3 and range [1,7]. The first period is 180° and the second 720°. Both start at y = 1, their minimum, because cosine is 1 at input zero and its coefficient is −3. The negative coefficient reflects the wave; its amplitude is the positive distance 3 from the midline y = 4. The input rates, rather than vertical scaling, distinguish the periods.
Tangent has a different repeating pattern
For y = a tan(bx) with a ≠ 0 and b > 0, the period is π/b radians, or 180°/b. Tangent repeats after a half-turn of its input because both sine and cosine change sign, leaving their ratio unchanged. It has no finite amplitude or greatest value: the ratio is unbounded near inputs where cosine is zero.
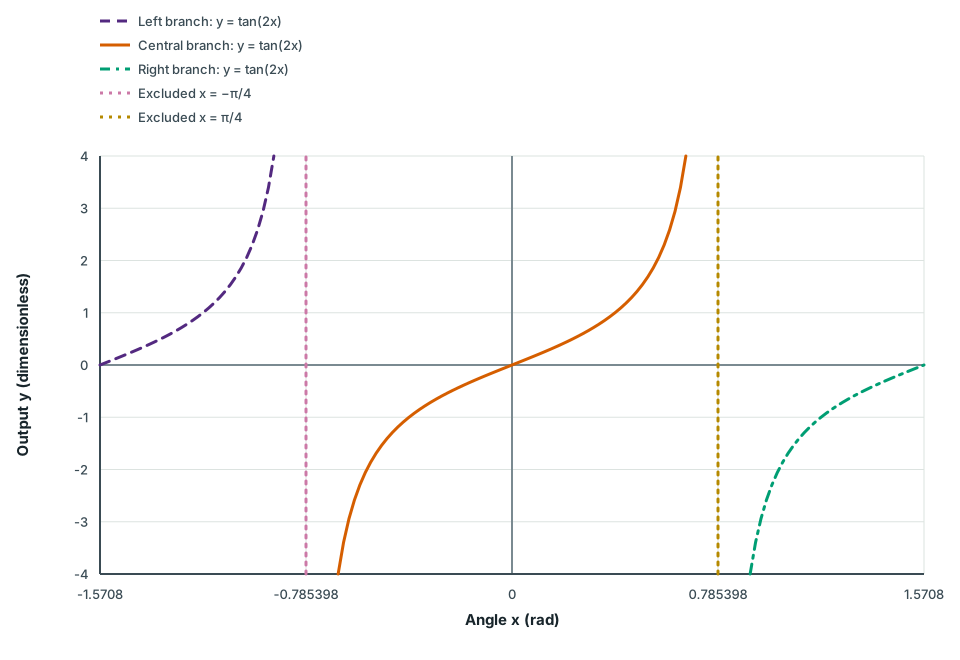
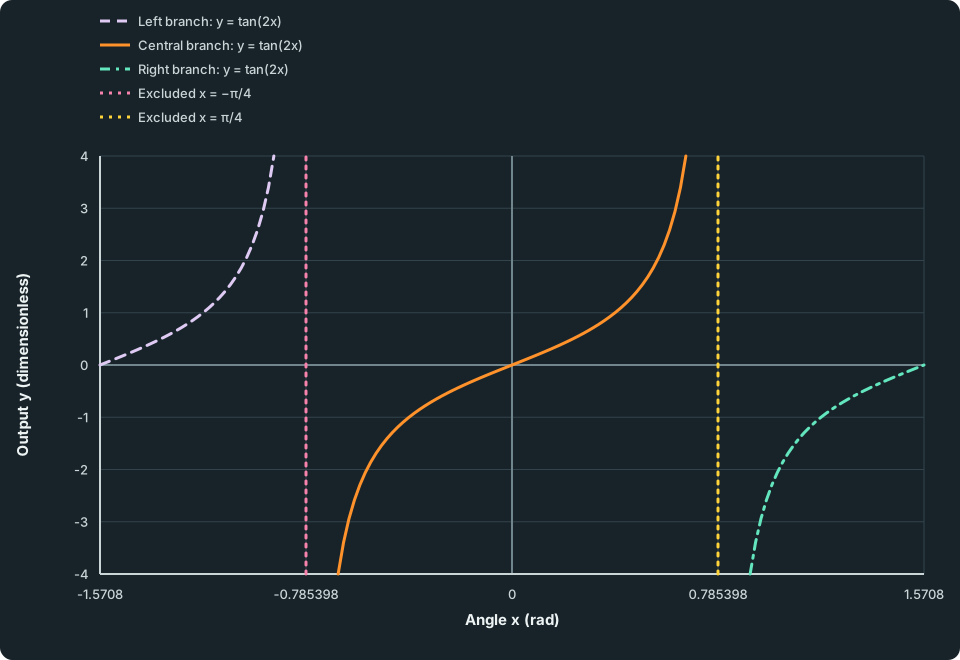
For y = tan(2x), the branch containing the origin lies between x = −π/4 and π/4. Those endpoints make cos(2x) = 0, so they are excluded. The branch crosses (0,0), passes through (−π/8,−1) and (π/8,1), and increases without bound near the right asymptote. The neighbouring branch is separate even though its shape repeats.
Tangent branches stay separate across excluded inputs
Three increasing tangent branches are drawn separately over x from −π/2 to π/2 radians. The central branch rises between the two excluded inputs −π/4 and π/4. Adjacent branches lie on the other sides of those asymptotes, with no connecting function stroke across either gap.
Scroll across the figure to read all labels.
View figure data
| Series | Angle x (rad) | Output y (dimensionless) |
|---|---|---|
| Left branch: y = tan(2x) | -1.57080 | 0.00000 |
| Left branch: y = tan(2x) | -1.55008 | 0.04146 |
| Left branch: y = tan(2x) | -1.52936 | 0.08305 |
| Left branch: y = tan(2x) | -1.50865 | 0.12494 |
| Left branch: y = tan(2x) | -1.48793 | 0.16726 |
| Left branch: y = tan(2x) | -1.46722 | 0.21017 |
| Left branch: y = tan(2x) | -1.44650 | 0.25384 |
| Left branch: y = tan(2x) | -1.42579 | 0.29844 |
| Left branch: y = tan(2x) | -1.40507 | 0.34415 |
| Left branch: y = tan(2x) | -1.38435 | 0.39119 |
| Left branch: y = tan(2x) | -1.36364 | 0.43977 |
| Left branch: y = tan(2x) | -1.34292 | 0.49017 |
| Left branch: y = tan(2x) | -1.32221 | 0.54265 |
| Left branch: y = tan(2x) | -1.30149 | 0.59755 |
| Left branch: y = tan(2x) | -1.28077 | 0.65523 |
| Left branch: y = tan(2x) | -1.26006 | 0.71614 |
| Left branch: y = tan(2x) | -1.23934 | 0.78078 |
| Left branch: y = tan(2x) | -1.21863 | 0.84974 |
| Left branch: y = tan(2x) | -1.19791 | 0.92373 |
| Left branch: y = tan(2x) | -1.17719 | 1.00362 |
| Left branch: y = tan(2x) | -1.15648 | 1.09044 |
| Left branch: y = tan(2x) | -1.13576 | 1.18549 |
| Left branch: y = tan(2x) | -1.11505 | 1.29036 |
| Left branch: y = tan(2x) | -1.09433 | 1.40708 |
| Left branch: y = tan(2x) | -1.07361 | 1.53827 |
| Left branch: y = tan(2x) | -1.05290 | 1.68732 |
| Left branch: y = tan(2x) | -1.03218 | 1.85880 |
| Left branch: y = tan(2x) | -1.01147 | 2.05891 |
| Left branch: y = tan(2x) | -0.99075 | 2.29637 |
| Left branch: y = tan(2x) | -0.97004 | 2.58379 |
| Left branch: y = tan(2x) | -0.94932 | 2.94018 |
| Left branch: y = tan(2x) | -0.92860 | 3.39550 |
| Left branch: y = tan(2x) | -0.90789 | 4.00000 |
| Central branch: y = tan(2x) | -0.66291 | -4.00000 |
| Central branch: y = tan(2x) | -0.64219 | -3.39550 |
| Central branch: y = tan(2x) | -0.62148 | -2.94018 |
| Central branch: y = tan(2x) | -0.60076 | -2.58379 |
| Central branch: y = tan(2x) | -0.58005 | -2.29637 |
| Central branch: y = tan(2x) | -0.55933 | -2.05891 |
| Central branch: y = tan(2x) | -0.53861 | -1.85880 |
| Central branch: y = tan(2x) | -0.51790 | -1.68732 |
| Central branch: y = tan(2x) | -0.49718 | -1.53827 |
| Central branch: y = tan(2x) | -0.47647 | -1.40708 |
| Central branch: y = tan(2x) | -0.45575 | -1.29036 |
| Central branch: y = tan(2x) | -0.43503 | -1.18549 |
| Central branch: y = tan(2x) | -0.41432 | -1.09044 |
| Central branch: y = tan(2x) | -0.39360 | -1.00362 |
| Central branch: y = tan(2x) | -0.37289 | -0.92373 |
| Central branch: y = tan(2x) | -0.35217 | -0.84974 |
| Central branch: y = tan(2x) | -0.33145 | -0.78078 |
| Central branch: y = tan(2x) | -0.31074 | -0.71614 |
| Central branch: y = tan(2x) | -0.29002 | -0.65523 |
| Central branch: y = tan(2x) | -0.26931 | -0.59755 |
| Central branch: y = tan(2x) | -0.24859 | -0.54265 |
| Central branch: y = tan(2x) | -0.22787 | -0.49017 |
| Central branch: y = tan(2x) | -0.20716 | -0.43977 |
| Central branch: y = tan(2x) | -0.18644 | -0.39119 |
| Central branch: y = tan(2x) | -0.16573 | -0.34415 |
| Central branch: y = tan(2x) | -0.14501 | -0.29844 |
| Central branch: y = tan(2x) | -0.12430 | -0.25384 |
| Central branch: y = tan(2x) | -0.10358 | -0.21017 |
| Central branch: y = tan(2x) | -0.08286 | -0.16726 |
| Central branch: y = tan(2x) | -0.06215 | -0.12494 |
| Central branch: y = tan(2x) | -0.04143 | -0.08305 |
| Central branch: y = tan(2x) | -0.02072 | -0.04146 |
| Central branch: y = tan(2x) | 0.00000 | 0.00000 |
| Central branch: y = tan(2x) | 0.02072 | 0.04146 |
| Central branch: y = tan(2x) | 0.04143 | 0.08305 |
| Central branch: y = tan(2x) | 0.06215 | 0.12494 |
| Central branch: y = tan(2x) | 0.08286 | 0.16726 |
| Central branch: y = tan(2x) | 0.10358 | 0.21017 |
| Central branch: y = tan(2x) | 0.12430 | 0.25384 |
| Central branch: y = tan(2x) | 0.14501 | 0.29844 |
| Central branch: y = tan(2x) | 0.16573 | 0.34415 |
| Central branch: y = tan(2x) | 0.18644 | 0.39119 |
| Central branch: y = tan(2x) | 0.20716 | 0.43977 |
| Central branch: y = tan(2x) | 0.22787 | 0.49017 |
| Central branch: y = tan(2x) | 0.24859 | 0.54265 |
| Central branch: y = tan(2x) | 0.26931 | 0.59755 |
| Central branch: y = tan(2x) | 0.29002 | 0.65523 |
| Central branch: y = tan(2x) | 0.31074 | 0.71614 |
| Central branch: y = tan(2x) | 0.33145 | 0.78078 |
| Central branch: y = tan(2x) | 0.35217 | 0.84974 |
| Central branch: y = tan(2x) | 0.37289 | 0.92373 |
| Central branch: y = tan(2x) | 0.39360 | 1.00362 |
| Central branch: y = tan(2x) | 0.41432 | 1.09044 |
| Central branch: y = tan(2x) | 0.43503 | 1.18549 |
| Central branch: y = tan(2x) | 0.45575 | 1.29036 |
| Central branch: y = tan(2x) | 0.47647 | 1.40708 |
| Central branch: y = tan(2x) | 0.49718 | 1.53827 |
| Central branch: y = tan(2x) | 0.51790 | 1.68732 |
| Central branch: y = tan(2x) | 0.53861 | 1.85880 |
| Central branch: y = tan(2x) | 0.55933 | 2.05891 |
| Central branch: y = tan(2x) | 0.58005 | 2.29637 |
| Central branch: y = tan(2x) | 0.60076 | 2.58379 |
| Central branch: y = tan(2x) | 0.62148 | 2.94018 |
| Central branch: y = tan(2x) | 0.64219 | 3.39550 |
| Central branch: y = tan(2x) | 0.66291 | 4.00000 |
| Right branch: y = tan(2x) | 0.90789 | -4.00000 |
| Right branch: y = tan(2x) | 0.92860 | -3.39550 |
| Right branch: y = tan(2x) | 0.94932 | -2.94018 |
| Right branch: y = tan(2x) | 0.97004 | -2.58379 |
| Right branch: y = tan(2x) | 0.99075 | -2.29637 |
| Right branch: y = tan(2x) | 1.01147 | -2.05891 |
| Right branch: y = tan(2x) | 1.03218 | -1.85880 |
| Right branch: y = tan(2x) | 1.05290 | -1.68732 |
| Right branch: y = tan(2x) | 1.07361 | -1.53827 |
| Right branch: y = tan(2x) | 1.09433 | -1.40708 |
| Right branch: y = tan(2x) | 1.11505 | -1.29036 |
| Right branch: y = tan(2x) | 1.13576 | -1.18549 |
| Right branch: y = tan(2x) | 1.15648 | -1.09044 |
| Right branch: y = tan(2x) | 1.17719 | -1.00362 |
| Right branch: y = tan(2x) | 1.19791 | -0.92373 |
| Right branch: y = tan(2x) | 1.21863 | -0.84974 |
| Right branch: y = tan(2x) | 1.23934 | -0.78078 |
| Right branch: y = tan(2x) | 1.26006 | -0.71614 |
| Right branch: y = tan(2x) | 1.28077 | -0.65523 |
| Right branch: y = tan(2x) | 1.30149 | -0.59755 |
| Right branch: y = tan(2x) | 1.32221 | -0.54265 |
| Right branch: y = tan(2x) | 1.34292 | -0.49017 |
| Right branch: y = tan(2x) | 1.36364 | -0.43977 |
| Right branch: y = tan(2x) | 1.38435 | -0.39119 |
| Right branch: y = tan(2x) | 1.40507 | -0.34415 |
| Right branch: y = tan(2x) | 1.42579 | -0.29844 |
| Right branch: y = tan(2x) | 1.44650 | -0.25384 |
| Right branch: y = tan(2x) | 1.46722 | -0.21017 |
| Right branch: y = tan(2x) | 1.48793 | -0.16726 |
| Right branch: y = tan(2x) | 1.50865 | -0.12494 |
| Right branch: y = tan(2x) | 1.52936 | -0.08305 |
| Right branch: y = tan(2x) | 1.55008 | -0.04146 |
| Right branch: y = tan(2x) | 1.57080 | 0.00000 |
| Excluded x = −π/4 | -0.78540 | -4.00000 |
| Excluded x = −π/4 | -0.78540 | 4.00000 |
| Excluded x = π/4 | 0.78540 | -4.00000 |
| Excluded x = π/4 | 0.78540 | 4.00000 |
Draw each branch without connecting across an asymptote. A calculator’s large finite display near π/2 does not define tan(π/2): approximate entry of π can place the calculation close to the excluded angle instead of exactly at it.
A constant zero sine or cosine function has no unique least positive period. For a = 0, do not apply a non-constant wave’s fundamental-period rule. The expression 0 tan(bx) still retains tangent’s original exclusions unless a separately defined extension fills them; multiplying an undefined value by zero does not define it.
A drawing should preserve the discontinuities
Check your understanding 2 Sketch the branch with its own restrictions
Sketch the branch of y = -2 tan(3x) containing the origin, with x in radians. Mark its asymptotes, zero and the points corresponding to tangent inputs ±π/4. State its period and describe how the negative coefficient changes the branch. You may draw on paper and compare with the criteria.
Show answer
The neighbouring asymptotes are x = −π/6 and π/6, both excluded; the zero is (0,0). The points are (−π/12,2) and (π/12,−2). The branch decreases from large positive values near the left asymptote to large negative values near the right one, because the coefficient −2 reflects and stretches tangent’s output. Its period is π/3. Keep the curve separate from the vertical asymptote guides; neither guide is part of the function. These labels, point values and branch directions are the sketch-comparison criteria, without automatic marking.
Interpret parameters with units
A stated water-depth model is d(t) = 3 + 2 sin(π t/6) metres for 0 ≤ t ≤ 24 hours. The phase πt/6 is in radians. Its midline is 3 m, amplitude 2 m, range 1 to 5 m and period 12 h, since πT/6 = 2π gives T = 12 h. At t = 3 h it reaches 5 m; at t = 9 h it reaches 1 m.
The coefficient π/6 describes phase change in radians per hour, rather than a period in hours. Keep that distinction when building a model. The stated time interval bounds the model’s use; its formula does not establish future water conditions outside that interval.
Try it yourself 1
Build a model from successive extrema
Problem
For 0 ≤ t ≤ 12 hours, a process’s height h is modelled by a single cosine wave with successive maxima 8 m at t = 0 and t = 6 h, and a minimum 2 m at t = 3 h. Find a model h(t) = a cos(bt) + c with bt in radians and b > 0. Explain the sign and units of its constants, check the three stated extrema and find h(1.5). A proposal uses b = 6 because the period is 6 h; decide whether that can match the data.
Write your answer, then compare it with the solution
Hints
Hint 1
Separate vertical distances from a full turn of phase
Use the two extreme heights for the midline and amplitude. Then ask how much the phase must increase between successive maxima, and match the starting height before choosing the coefficient’s sign.
Show full solution
Recover the vertical parameters
Method
Use the midpoint and half-difference of the two extreme heights.Reason
The midline lies equally far from the maximum and minimum, while amplitude is that positive distance.Working
Answer
The midline is c = (8 + 2)/2 = 5 m and amplitude (8 − 2)/2 = 3 m. Since h(0) = a + c is the maximum 8 m, choose a = +3 m. A negative a would start at the minimum instead.Convert the period into a phase rate
Method
Use the 6 h separation between successive maxima.Reason
A full cycle requires the phase bt to increase by 2π radians.Working
Answer
Thus 6b = 2π, giving b = π/3 radians per hour. The model is h(t) = 3 cos(π t/3) + 5 metres. Choosing b = 6 radians per hour would instead give period 2π/6 = π/3 h, contradicting the stated successive maxima.Check the extrema and intermediate prediction
Method
Substitute the stated times and t = 1.5 h into the model.Reason
The height range alone cannot check the period, starting phase or behaviour between extrema.Working
Answer
At t = 0, 3 and 6 h the phases are 0, π and 2π, giving heights 8, 2 and 8 m as required. At t = 1.5 h the phase is π/2, so h = 5 m, on the descending part of the cycle. These checks agree with the stated model on 0 ≤ t ≤ 12 h; they do not prove that an unstated physical process follows it beyond that interval.
Quick check
Compare the starting phase, midline, amplitude, successive-maxima spacing and units separately. The period and the input coefficient are different quantities. A model must fit the stated assumptions as well as reproduce the listed heights.
Keep track of this lesson
Mark the lesson done when you have worked through it.
Lesson progress is optional and kept on this device.
Loading lesson controls…
Your lesson mark records your own study. Checks are kept separately in My Learning.